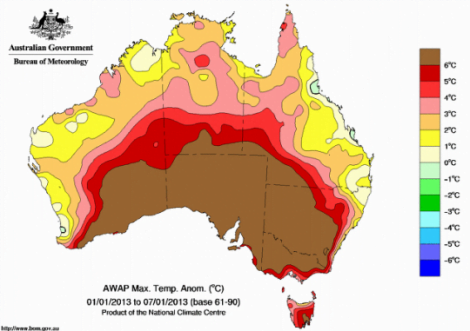
These maps from the Australian Government’s Bureau of Meteorology are warnings of the hot, hot future our planet has in store for us as the effects of climate change become more acute.
The figures on the right are the degrees (in Celsius) above the average temperatures recorded between January 1 and January 7 from 1961 to 1990. As you can see much of the country is 6 degrees above average for this time of year.

It’s so hot, the Australian weather map requires a new color to visually represent what may become a new normal.
